2023: Volume 4, Issue 1
Past Issues
 Abstract
  PDF
PDFApplication of Mathematical Model-Latent Class Model in Methodological Evaluation of Diagnostic Algorithms and Imperfect Reference Standard of Selected Index Test Techniques in Parasitology
Azuonwu Obioma1,*, Ihua, Nnenna1, Adebayo-Olajide Testimonies2, Chikanka Onwuli Donatus3, Reuben E4, Orabueze, Ifeoma Celestina5, Azuonwu Goodluck6, Poplong Natasha Angel7, Tamuno-Boma8, Odinga, Omaegbu Ebere Elizabeth9, John-Amadi Victory Sorbari10, Ekwuozor, Ikem Kris Eloka10, Wokem Gloria Ngozika1, Vetty Agala11
1Department of Medical Laboratory Science, Medical Bacteriology/Virology/Parasitology Unit, Rivers State University, Nkpolu–Oroworukwo, Port Harcourt, Rivers State, Nigeria.
2 Department of Microbiology and Biotechnology, Caleb University, Lagos, Nigeria
3Department of Medical Laboratory Science, Chemical Pathology Unit, Rivers State University, Nkpolu–Oroworukwo, Port Harcourt, Rivers State, Nigeria
4Department of Human Physiology, College of Medicine, Rivers State University, Nkpolu–Oroworukwo, Port Harcourt, Rivers State, Nigeria
5Faculty of Pharmacy, Department of Pharmacovigilance, University of Lagos, Nigeria
6Department of Nursing, University of Port Harcourt, Choba, Nigeria
7 Departments of Biological Science, Faculty of Science, Federal University of Kashere, Gombe State, Nigeria
8Department of Biochemistry, Rivers State University, Nkpolu–Oroworukwo, Port Harcourt, Rivers State, Nigeria
9Department of Computer Science, Rivers State University, Nkpolu–Oroworukwo, Port Harcourt, Rivers State, Nigeria
10Department of Animal and Environmental Biology, Rivers State University, Nkpolu–Oroworukwo, Port Harcourt, Rivers State, Nigeria
11Department of Community Medicine, University of Port Harcourt, Choba Nigeria
*Corresponding Author: Azuonwu Obioma, Rivers State University, Port Harcourt, Nkpolu–Oroworukwo, Port Harcourt, Rivers State, Nigeria; Email: [email protected]
Received Date: March 9, 2023
Publication Date: April 26, 2023
Citation: Obioma A, et al. (2023). Application of Mathematical Model-Latent Class Model in Methodological Evaluation of Diagnostic Algorithms and Imperfect Reference Standard of Selected Index Test Techniques in Parasitology. Clin Res. 4(1):6.
Copyright: Obioma A, et al. © (2023).
ABSTRACT
Background: Disease diagnosis cannot be made with certainty thus, choosing the best diagnostic strategy is basic for understanding patient management outcomes. This requires substantiation of the comparative performance of diagnostic algorithms. The use of a single index test in parasitic detection has been invalid and had also proven unacceptable among critical professionals. The aim of this study anchors on Methodological Evaluation of Diagnostic Algorithms and Imperfect Composite Reference Standard of Selected Index Test Techniques in Parasitology using the application of mathematical models-Latent class model. It will also compare the diagnostic performance of three index test techniques in the detection of parasites, using Extrapolated-composite Imperfect Reference Standard and Bayesian Latent Class Model. Study Protocol: This study was carried out in Rivers State, Nigeria. Laboratory investigation of the index test techniques for direct microscopy, Brine microscopy and Diethyl Ether Microscopy followed the routine parasitological methods with a sample size of eighty. The imperfect reference (gold) standard was extrapolated from a combination of the three index test techniques. All tests were categorically analysed as binary outcomes (positive or negative). Statistical analysis was performed using SPSS version 21 to test for inter-rater agreement and other concordance indices. Sensitivity, Specificity, Positive Predictive Value, Negative Predictive Value, Prevalence, Likelihood Ratio Positive and Negative, False Discovery Rate, False Omission Rate, and Diagnostic Odd Ratio, Kappa, Kendall's Coefficient of Concordance, average Spearman Correlation and Cochran Q were the test statistics used in this study. An alpha level of 5% was set for decision. Also, Bayesian latent class Model was performed with Modelling of Infectious Disease Centre (MICE) Model Code MODEL103. Results: For detection rate, Direct Microscopy was the least while Diethyl Ether Microscopy was the highest. Strong concordance was observed showing good inter-rater agreement. The study generally recorded low sensitivity irrespective of the technique or model used. Composite reference standard did not differ statistically (p>0.05) from the Latent Class Model only for sensitivity, others showed marked variation (p<0.05). Conclusion: This current study has been able to bear out the significance of LCM as a useful tool.
Keywords: Diagnostic, Algorithms, Imperfect, Reference, Standard, Parasitology, Methodological, Evaluation, Index, Test, Techniques, Extrapolated, Bayesian, Latent, Class, Model
INTRODUCTION
Intestinal parasites are even today major contributors to the global burden of disease burden, affecting especially the population living in regions, in the developing countries according to the report of Alum and colleagues (Alum et al., 2010) [1]. Neglected tropical diseases have gained global attention despite the fact that it is a major problem of the developing nations thus, lymphatic filariasis and soil-transmitted helminths like Ascaris lumbricoides, Hookworm and Trichuristrichiura have contributed to increased disease burden of unimaginable proportion (Harhay et al., 2011) [2]. Furthermore, in recent time; zoonotic helminths have been increasingly reported as a cause of spurious infection in human beings (Gonçalves et al., 2012) [3]. Nevertheless, general public health safe practices cum personal hygiene among other factors like potable water availability, socio-economic conditions, education, temperature, humidity and the survival of the environmental different stages of the parasites are some of the factors that determine and promote the transmission of intestinal parasites (Alum et al., 2010) [1].
However, intestinal parasitoses are common parasitic infections and hence, various techniques have been used for examination of intestinal parasitic diseases (Mulat et al., 2015) [4]. However, direct wet mount brine and Formol ether concentration techniques have been used as a means of diagnosis for several years in Africa (Moges et al., 2010) [5]. Although other diagnostic methods are available including immunoassay and molecular technique, direct microscopy is commonly used as a diagnostic method in parasitology (Knopp et al., 2009) [6]. Direct microscopy is most commonly used technique due to the fact that it is fast, it does not consume time, cheap and permits the concurrent detection of the various classes of parasites either helminths or protozoans (Camacho et al., 2012; Canavate et al., 2012; Ribeiro and Furst, 2012; Tello et al., 2012) [7-10]. Based on these, in some low and mid economic settings, the use of direct microscopy is preferred and seldom used over the tests like Brine Microscopy and Diethyl-Ether Microscopy. Although, techniques based on centrifugation have demonstrated to be better (Canavate et al., 2012) [8]. This is not without exceptions anyway [(Devera et al., 2008; Tello et al., 2012) [10,11]. The quest of what index test techniques possess the best diagnostic accuracy is still unclear.
Selecting the most effective diagnostic method is essential for good patient management and public health interventions. This requires substantiation of the comparative performance of alternative tests or diagnostic algorithms. As a result, there is a need for diagnostic test accuracy. Also, another barrier is that the diagnostic accuracy of the tests is usually determined through the comparison of the index test results with those of a reference standard. These reference standards are presumed to be perfect, i.e. allowing the classification of diseased and non-diseased subjects without error. In practice, this assumption is however rarely valid and most reference standards show false-positive or false-negative results. When an imperfect reference standard is used, the estimated accuracy of the tests of interest may be biased, as well as the comparisons between these tests.
The importance of accurate diagnosis cannot be overemphasized. Accurate disease diagnosis is the first step in the appropriate treatment and management of patients. Often, the issues of diagnostic conflicts and in-conclusive results seem the outcome of studies assessing the diagnostic accuracy of test algorithms including findings of some meta-analysis. Performance evaluation of diagnostic tests is critical in the search for accurate diagnoses. A gold standard test is usually absent in parasitology, thus rendering satisfactory assessment of diagnostic accuracy difficult.
Assessments of the presence or absence of a condition cannot constantly be made with confidence (Sullivan & Holly, 2007) [12]. Latent class analysis has been proposed as a statistical technique that allows disease assessment in the absence of a gold standard or the presence of an imperfect gold reference standard from earlier studies (Dawid & Skene 1979; Walter & Irwig, 1988) [13,14]. Latent class analysis (LCM) is used to assess diagnostic test accuracy when a gold standard assessment of disease is not available but results of multiple imperfect tests are or when it is impossible to perform in field conditions such as seen in parasitology. The latent class model has two latent classes, indicating diseased and non-diseased. In its basic format, latent class analysis requires the observed outcomes to be statistically independent conditional on the disease status.
In this model, the disease status is an unobserved, or latent, variable, and a probabilistic model is assumed for the relationship between results of several imperfect diagnostic tests results and the latent disease status (Pepe, 2007) [15]. Estimation of the Latent Class Analysis model is either through maximum likelihood (Goetghebeur et al., 2000; Black & Craig 2002) [16,17] or Bayesian methods (Goetghebeur et al., 2000; Dendukuri & Joseph, 2001; Bernatsky et al., 2005) [16,18,19] to achieve diagnostic accuracy of the tests. This present study utilized the later method.
This study considered the basis, where three index tests were observed and conditional independence (CI) assumed. Concordance and inter-rater agreement were noted. The study showed explicitly how observed two and three-way associations between test results are used to infer disease prevalence and diagnostic accuracy of test true and false positive rates as well the achievement of the study purpose based on some rationales.
Diagnostic investigation is key in the search for accurate diagnostic techniques to provide adequate patient care, assess drug efficacy, monitor the effectiveness of control programs and obtain proper knowledge of the parasitic epidemiology (Tarafder et al., 2010; Harhay et al., 2011) [2,20].
Assumption of a perfect reference standard in practice is rarely valid. Nevertheless, less than perfect reference standards which differ between studies may have been used. The use of latent variables model in diagnostic studies is to adjust for the use of imperfect reference standards. Many diagnostic studies are small and give imprecise estimates (Bachmann et al., 2006) [21]. Also, in the field of parasitology, no validated gold reference standard has been established. Besides, composite reference (gold) standard and LCM have not been applied within the locale of this study.
The purpose of this study was Methodological Evaluation of Diagnostic Algorithms and Imperfect Composite Reference Standard of Selected Index Test Techniques in Parasitology; to compare the diagnostic performance of three index test techniques in the detection of parasites, using Extrapolated-composite Imperfect Reference Standard and Bayesian Latent Class Model. This was specifically handled via;
- Determining diagnostic accuracy of selected index test techniques (Direct Microscopy, Brine Microscopy and Diethyl-Ether Microscopy) using an extrapolated-composite reference (gold) standard.
- Calculating the inter-rater agreement between any two index test techniques using Kappa.
- Measuring trend of agreement and intra-test homogeneity of the selected three index test techniques (Direct Microscopy, Brine Microscopy and Diethyl-Ether Microscopy) using Kendall's Coefficient of Concordance, average Spearman Correlation and Cochran's Q.
- Computing Diagnostic accuracy using Bayesian Latent Class Model (LCM) amidst imperfect reference (gold) standard.
- Comparing diagnostic accuracies of the extrapolated-composite reference (gold) standard and the Bayesian Latent Class Model (LCM)
Study Protocol: This study was carried out in Rivers State, Nigeria. Laboratory investigation followed the conventional parasitology methods and carried at the Microbiology Laboratory of University of Port Harcourt Teaching Hospital, Rivers State, Nigeria. Three tests were performed for each subject. About eighty samples were used. The index test techniques used were direct microscopy, Brine microscopy and Diethyl Microscopy. The imperfect reference (gold) standard was extrapolated from a combination of the three index test techniques. All tests were categorically analysed as binary outcomes (test positive or negative).In addition, the composite reference standard method results were analysed SPSS. Statistical analysis was performed using SPSS version 21 to test for inter-rater agreement and other concordance indices. Sensitivity, Specificity, Positive Predictive Value, Negative Predictive Value, Prevalence, Likelihood Ratio Positive and Negative, False Discovery Rate, False Omission Rate, and Diagnostic Odd Ratio, Kappa, Kendall's Coefficient of Concordance, average Spearman Correlation, Cochran Q were the test statistics used in this study. An alpha level of 5% was set for decision.
A Bayesian latent class approach (Joseph et al., 1995) [22] was used to obtain estimates for the sensitivity, specificity, and prevalence of the two techniques and the proportion of positives for each intestinal parasite. The conditional dependence between the three tests was estimated using a fixed parameter (Gelman & Joseph, 2001) [23]. Modelling of Infectious Disease Centre (MICE)-Imperfect Gold Standard Models was used to estimate Bayesian Class Model. Model Code MODEL103, Model Name The 3-tests in 1-population Model (Simplified Interface) and Job ID 20191025165737363. MICE is funded by Li KaShing and Wellcome trust and initiated under collaboration between Mahidol-Oxford Tropical Medicine Research Unit (MORU) and Faculty of Tropical Medicine, Mahidol University, Thailand. The underlying principle of LCM is as follows; the Two Latent Class Model (2 LCM) was used in this study. In this model, the true disease/infection status of an individual is considered a latent variable, with two mutually exclusive categories (1 indicating. diseased/infected/positive and 0 means non-diseased/non-infected)/negative. The manifest binary variables that express the diagnostic test results, only give an indication of disease/infection status. The 2 LCM assumes that, given the true state of the disease or infection, the results of the diagnostic tests are independent. This assumption is known as the Hypothesis of Conditional Independence (HCI). In general, inferences were based on a number of iterations after discarding an initial burn-in of iteration numbers. Convergence is assessed by running multiple chains from various starting values according to Gelman , et al. (Gelman & Joseph, 2001) [23].
This study applied this principle by running dissimilar chains from different starting points to assess convergence while ensuring robust estimation. Model convergence was assessed using Gelman and Rubin convergence statistics. The total number of burn-in iterations was 2,000, this was the first 2000 iterations and was discarded as burn-in while the Total number of iterations used for analysis = 20,000 and this next 20,000 iterations by chain were used to parameterize the model via obtaining a sample of the marginal posterior density for each parameter (proportion of positive cases, sensitivity and specificity). Also, thinning intervals was 10 and used to assess the probability of observed frequencies, assuming the model was true. The median and the credible interval of these samples were used as point and interval estimation of the parameter. All parameters were estimated with 95% credible intervals (Bayesian version of the confidence intervals). Convergence was monitored using the standard diagnostic procedures based on a visual assessment of the long chains for each parameter and using the Gelman-Rubin and the Raftery-Lewis measures (Smith, 2007) [24]. Furthermore, the Bayesian p-value was calculated as described in detail by Nérette, et al. (2008) [25]. This version of Bayesian p-value suggests the lack of fit when p-values near 0 or 1 (Gelman & Joseph, 2001; Nérette et al., 2008; Neelon et al., 2011) [25,26]. Below are the results obtained.
RESULTS
A total of eighty (80) stool samples were subjected to the analysis of three replicates by each index test techniques.
Table 1, Frequency distribution of infection status using various index techniques for single Direct Microscopy =14 (17.5), Brine Microscopy=17 (21.3) and Diethyl-Ether Microscopy=19 (23.8). This report showed Diethyl-Ether Microscopy to be the technique with the highest number of parasite detection whereas, direct microscopy appeared to be the least. Comparatively, double combinations of index techniques showed no dissimilarity in the detection order like the single. The triple combination of all three index techniques used in this study revealed a detection frequency/rate of 50 (62.5). This triple index technique combination showed a synergic detection effect by implication was chosen to be the assumed gold reference standard in this study, otherwise referred to as imperfect reference gold standard or Extrapolated-Composite Gold Standard.
Table 1: Frequency Distribution of Infection Status using various Techniques/Combination.
|
Index Test Techniques |
Index Technique/Combination |
Number Tested (%) |
Number Negative (%) |
Number Positive (%) |
|
Single |
Direct Microscopy |
80 |
66 (82.5) |
14 (17.5) |
|
|
Brine Microscopy |
80 |
63 (78.8) |
17 (21.3) |
|
|
Diethyl-Ether Microscopy |
80 |
61 (76.3) |
19 (23.8) |
|
|
|
|
|
|
|
Double |
Direct Microscopy * Brine Microscopy |
80 |
49 (61.3) |
31 (38.8) |
|
|
Direct Microscopy * Diethyl-Ether Microscopy |
80 |
47 (58.8) |
33 (41.2) |
|
|
Brine Microscopy* Diethyl-Ether Microscopy |
80 |
44 (55.0) |
36 (45.0) |
|
|
|
|
|
|
|
Triple |
Direct Microscopy * Brine Microscopy* Diethyl-Ether Microscopy |
80 |
30 (37.5) |
50 (62.5) |
Determine diagnostic accuracy of selected index test techniques (Direct Microscopy, Brine Microscopy and Diethyl-Ether Microscopy) using an extrapolated/combined reference (gold) standard.
Table2: Sensitivity, Specificity, PPV, NPV and Prevalence Estimated using Extrapolated/Combined Gold Standard (Imperfect). A prevalence of 63% was obtained in this study. For the index test technique used in this present study, the following results were reported based on diagnostic algorithm; Diethyl-Ether Microscopy (38%) was the most sensitive while Direct microscopy (28%). Correspondingly, the Positive Predictive Value shared equal rating order. On the other hand, Direct microscopy (35%) had the highest specificity and
Diethyl-Ether Microscopy (32%) had the lowest. Similarly, this is in consonance with the outcome of the Negative Predictive Value (NPV).
Table 2: Sensitivity, Specificity, PPV, NPV and Prevalence Estimated using Extrapolated/Combined Gold Standard.
|
Index Tests (Techniques) |
Sensitivity (%) |
Specificity (%) |
PPV (%) |
NPV (%) |
Prev (%) |
|
Direct Microscopy |
28 |
35 |
0.456 |
0.013 |
|
|
Brine Microscopy |
34 |
33 |
0.519 |
0.010 |
63 |
|
Diethyl-Ether Microscopy |
38 |
32 |
0.555 |
0.009 |
|
Prev=Prevalence, PPV= positive predictive value, NPV=Negative predictive value
Table 3 further illustrates diagnostic testing revealed more about the test accuracy using diagnostic indices like: Likelihood Ratio Positive and Negative, False Discovery Rate, False Omission Rate, and Diagnostic Odd Ratio. In this study, it was observed that Diethyl-Ether Microscopy showed the highest percentage for Likelihood Ratio Positive (1.230), Diagnostic Odd Ratio (1.422), and False Omission Rate (0.991). But recorded the lowest percentage for Likelihood Ratio Negative (0.865) and False Discovery Rate (0.445). Nonetheless, Direct Microscopy displayed contradictions to Diethyl-Ether Microscopy in all indices measured, Refer to table 2 for detail.
Table 3: LR (Pos), LR(Neg), DOR, FDR and FOR.
|
Index Tests (Techniques) |
LR (Pos) |
LR(Neg) |
DOR |
FDR |
FOR |
|
Direct Microscopy |
0.824 |
1.290 |
0.639 |
0.544 |
0.987 |
|
Brine Microscopy |
1.030 |
1.000 |
1.030 |
0.481 |
0.990 |
|
Diethyl-Ether Microscopy |
1.230 |
0.865 |
1.422 |
0.445 |
0.991 |
LR=Likelihood Ratio, Pos=Positive, Neg=Negative, FDR=False Discovery Rate, FOR=False Omission Rate, DOR= Diagnostic Odd Ratio
Evaluate inter-rater agreement between any two index test techniques using Kappa.
Table 4 showed Kappa index (Broemeling, 2009) [27] which is the inter-rater agreement was calculated to assess the diagnostic concordance between the Index test techniques. This study demonstrated very good agreement when weighed on Cohen's kappa classification scale. However, the diagnostic concordance between Brine Microscopy* Diethyl-Ether Microscopy had the highest rating (0.928) while Direct Microscopy * Diethyl-Ether Microscopy was the least (0.810) although it is on the lower limit of classification range termed very good.
Table 4: Inter-Rater Agreement using Kappa.
|
Index Tests/Techniques Combination |
Kappa (k) value |
p-value |
Agreement Status |
|
Direct Microscopy * Brine Microscopy |
.880 |
0.00 |
Very Good |
|
Direct Microscopy * Diethyl-Ether Microscopy |
.810 |
0.00 |
Very Good |
|
Brine Microscopy* Diethyl-Ether Microscopy |
.928 |
0.00 |
Very Good |
Classification of Cohen's kappa; < 0.20=Poor, 0.21-0.40=Fair, 0.41-0.60=Moderate, 0.61-0.80=Good, 0.81-1.00=Very Good
Measure trend of agreement and intra-test homogeneity of the selected three index test techniques (Direct Microscopy, Brine Microscopy and Diethyl-Ether Microscopy) using Kendall's Coefficient of Concordance, average Spearman Correlation and Cochran's Q.
Table 5; Kendall's Coefficient of Concordance was used to assess the trend of agreements (inter-rater)among the three techniques. A Kendall's W=.048, df=2 and p=.022 demonstrate a level of disagreement. Hence, no overall trend of agreement among the index test techniques and the detections may essentially be regarded as random. The outcome here shows that Diethyl-Ether Microscopy technique was rated high in terms of parasite detection as represented by the mean Rank = 2.04. In addition to the measure of concordance, the average Spearman Correlation over index test techniques was used to measure concordance over the three techniquesand extrapolated from Kendall’s as -0.428.
Table 5: Kendall's Coefficient of Concordance.
|
Index Tests /Techniques |
Rank |
Kendall's W |
Chi-Square |
Df |
p-value |
|
Direct Microscopy |
1.95 |
|
|
|
|
|
Brine Microscopy |
2.01 |
.048 |
7.600 |
2 |
.022 |
|
Diethyl-Ether Microscopy |
2.04 |
|
|
|
|
Kendall's W value 0= Perfect Disagreement, 1= Perfect Agreement. Average Spearman Correlation=kw-1/k-1=3(0.048)-1/3-1= -0.428.
Equally, the Cochran Q test was used to test intra-test homogeneity, that is, that assessed if the percentage of positive results was the same among the three replicates of each index test techniques. The result here showed Cochran's Q =7.600, df=2 and p=0.02. This implies that assuming the three techniques are similar as hypothesized, there is still a 0.2% chances of finding the differences the researcher observed in this sample. Since this chance is smaller than 5%, the researcher rejects the null hypothesis. See table 6.
Table 6: Cochran's Q (intra-test homogeneity) of the selected Techniques.
|
Infection Status |
||||||
|
Index Tests /Techniques |
Positive |
Negative |
Total |
Cochran's Q |
Df |
p-value |
|
Direct Microscopy |
14 |
66 |
80 |
|
|
|
|
Brine Microscopy |
17 |
63 |
80 |
7.600 |
2 |
0.02 |
|
Diethyl-Ether Microscopy |
19 |
61 |
80 |
|
|
|
|
|
||||||
Compute Diagnostic accuracy using Bayesian Latent Class Model (LCM) amidst imperfect reference (gold) standard
Table 7: The study exploited a novel model known as Bayesian latent class model (LCM). Prevalence, sensitivities and specificities, positive and negative predictive values (PPV and NPV) were estimated using Bayesian latent class model (LCM).The bayesian latent class model assumed that all tests evaluated are imperfect. Values shown are estimated median with 95% credible interval (CrI 95%).LCM revealed a prevalence (%) of 6.0 (0.0 - 99.1). The sensitivity result in LCM showed Diethyl-Ether Microscopy as the most sensitive -41.4 (0.4 - 99.5 and Direct Microscopy as the least -39.9 (0.3 - 99.6). Likewise, the positive predictive value followed a comparable pattern of rating. However, specificity rates showed that Direct Microscopy had the highest specificity-61.0 (46.6 - 92.1) while Diethyl-Ether Microscopy had the least specificity-58.8 (46.8 - 91.0). The NPV is equivalent to the specificity rating, Direct Microscopy been highest and Diethyl-Ether Microscopy the least.
Table 7: Bayesian latent class model (%) Analysis of the Three Techniques.
|
Parameters |
Direct Microscopy Median (CrI 95%) |
Brine Microscopy Median (CrI 95%) |
Diethyl-Ether Microscopy Median (CrI 95%) |
|
Prevalence (%) |
6.0 (0.0 - 99.1) |
|
|
|
Sensitivity |
39.9 (0.3 - 99.6) |
41.0 (0.3 - 99.4) |
41.4 (0.4 - 99.5) |
|
Specificity |
61.0 (46.6 - 92.1) |
59.8 (46.5 - 93.6) |
58.8 (46.8 - 91.0) |
|
PPV |
5.6 (0.0 - 99.7) |
5.4 (0.0 - 99.8) |
5.7 (0.0 - 99.8) |
|
NPV |
95.0 (1.1 - 100) |
94.8 (1.0 - 100) |
94.6 (1.1 - 100) |
Cr=Credible Interval= Is the interval in which an unobserved parameter has a given probability
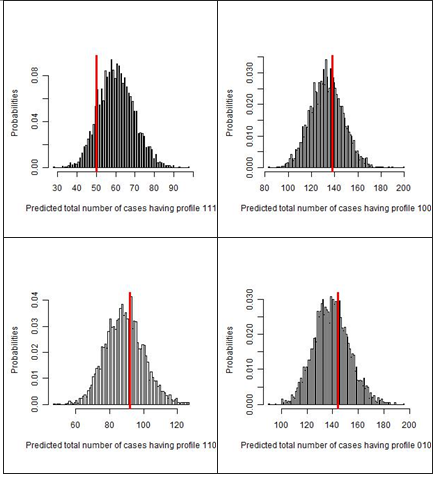
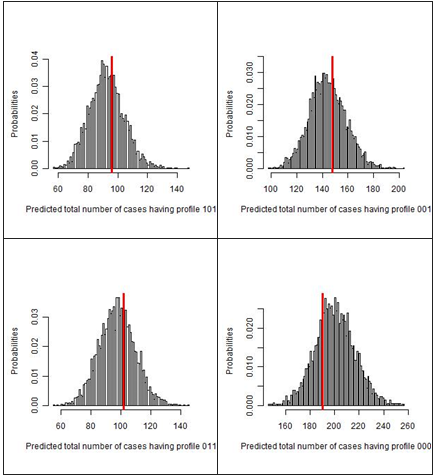
Table 8 presents the Bayesian Latent Class Model. Checking for fitness of Bayesian LCM,three conditionally independent index test techniques used produced eight (8) possible outcome patterns (111=+ + +, 110=+ + −, 101= + − +, 011=− + +, 100= + − −, 010= − + −, 001= − − +, 000=− − −).This assesses the agreement between "frequency observed" and "frequency predicted" using Bayesian p-value and posterior predictive distribution of each profile. This model allows for imperfect reference standards.
The bayesian p-value is the probability that replicate data (predicted frequency) from the Bayesian model were more extreme than the observed data. A Bayesian p-value close to 0 or 1 indicates that the observed result would be unlikely to be seen in a replication of the data if the mode was true. This means that when Bayesian p-value is close to 0.5 or exactly 0.5, the Bayesian model describes the observed data very well
Table 8: Bayesian Latent Class Model Fitness Check.
|
Profiles |
Direct Microscopy |
Brine Microscopy |
Diethyl-Ether Microscopy |
Frequency observed |
Frequency predicted |
Bayesian p-value |
|
111 |
Positive |
Positive |
Positive |
50 |
60 |
0.898 |
|
110 |
Positive |
Positive |
Negative |
92 |
89 |
0.414 |
|
101 |
Positive |
Negative |
Positive |
96 |
93 |
0.402 |
|
011 |
Negative |
Positive |
Positive |
102 |
98 |
0.384 |
|
100 |
Positive |
Negative |
Negative |
138 |
133 |
0.387 |
|
010 |
Negative |
Positive |
Negative |
144 |
140 |
0.386 |
|
001 |
Negative |
Negative |
Positive |
148 |
144 |
0.411 |
|
000 |
Negative |
Negative |
Negative |
190 |
201 |
0.759 |
Positive=1, Negative=0.
|
|
|
|
Figure1: Histogram showing frequency distribution of the three test results Red line represents the observed frequency of each test result profile, while the histograms illustrate the predictive posterior distribution of predicted frequency. In each of the figures, a dataset was replicated for 20,000 times and selected only 2,000 times (thin sampling equals to 10) to assess the probability of observed frequencies, assuming the model was true. |
|
Compare diagnostic accuracies of the extrapolated/combined reference (gold) standard and the Bayesian Latent Class Model (LCM)
Table 9, *Gold standard model assumed that the gold standard test is perfect (100% sensitivity and 100% specificity; all patients with gold standard test positive are diseased and all patients with gold standard test negative are non-diseased). However, the study tested the index test techniques against the extrapolated composite gold standard (which was obtained from a combination of all index test techniques).
** Bayesian latent class model assumed that all tests evaluated are imperfect.
Comparison of Gold Standard and Bayesian Class Models revealed considerable discrepancies (p<0.05) in all the parameters (Prevalence, Sensitivity, Specificity, PPV and NPV) investigated via the index test technique except for the sensitivity of Diethyl-Ether Microscopy (p>0.05). See the table below.
Table 9: Comparison of Gold Standard and Bayesian Class Model.
|
Index Tests (Techniques) |
Parameter |
*Composite Gold Standard Model (%) |
**Bayesian Class Model (%) |
p-value |
|
Direct Microscopy |
Prevalence |
63 |
6.0 |
P<0.05 |
|
|
Sensitivity |
28 |
39.9 |
P<0.05 |
|
|
Specificity |
35 |
61.0 |
P<0.05 |
|
|
PPV |
0.456 |
5.6 |
P<0.05 |
|
|
NPV |
0.013 |
95.0 |
P<0.05 |
|
|
|
|
|
|
|
Brine Microscopy |
Sensitivity |
34 |
41.0 |
P<0.05 |
|
|
Specificity |
33 |
59.8 |
P<0.05 |
|
|
PPV |
0.519 |
5.4 |
P<0.05 |
|
|
NPV |
0.010 |
94.8 |
P<0.05 |
|
|
|
|
|
|
|
Diethyl-Ether Microscopy |
Sensitivity |
38 |
41.4 |
P>0.05 |
|
|
Specificity |
32 |
58.8 |
P<0.05 |
|
|
PPV |
0.555 |
5.7 |
P<0.05 |
|
|
NPV |
0.009 |
94.6 |
P<0.05 |
P<0.05=Significant. P>0.05=Not Significance
DISCUSSION
Accurate diagnosis of diseases is essential in health care in developing countries where infections are the most common causes of death and ill health (Peeling et al., 2007) [28]. Modern medicine has scaled up from mere observation (clinical signs and symptoms) to more empirical and evidence-based and is currently in the precision arena. Observable signs and symptoms are often not adequately accurate and may perhaps lead to issuing inappropriate treatment and inducing resistance as there are cases of anti-helminth resistance (Peeling et al., 2007) [28]. Molecular detection is not readily available and may be costly, insufficiently sensitive, and difficult or dangerous to perform under field conditions. This is a common case in parasitic infections like visceral leishmaniasis (Boelaert et al., 2007) [29].
Parasitology has been challenged by the unavailability of a gold reference standard thus, this study adopted the use of a composite reference standard extrapolated via a combination of the results of the three index test techniques as a standard test (imperfect gold standard). This is in agreement with earlier studies such as a study done by Mulat et al. (2015) [4] and another done in Gondar according to Endris and colleagues (Endris et al., 2013) [30]. In this study, Diethyl-Ether Microscopy outperformed the other two techniques. In comparison to parasite detection, findings here confirmed that Diethyl-Ether Microscopy was high as compared to the other two techniques. This result agrees favourably with other similar studies done previously (Moges et al., 2010) [5]. Besides, the detection rate of intestinal parasites with direct microscopy was lower than the Diethyl-Ether Microscopy in the present study. This result is in agreement with the Ethiopian study (Mulat et al., 2015) [4] and another study conducted in Nigeria (Sheyin et al., 2013) [31].
This present study is in consonance with the study of Santos, Luciano, Cerqueira and Soares in 2005 (Santos et al., 2005) [32] in that, Diethyl-Ether Microscopy demonstrated higher sensitivity than the other index test techniques used in the study. In addition, evidence from this study proved that Diethyl-Ether Microscopy recovery efficiency for parasites is greater than the direct microscopy and Brine techniques. This particular finding has been proven over the years even observed in an age-long study (Ritchie, 1984) [33]. Similarly, Levecke et al. (2009) [34] also recorded low sensitivity of the direct microscopy technique in the detection of low intensity of infection as observed in this study. And another study established an equivalent finding (Endris et al., 2013) [30]. This indicates that the use of direct microscopy as a confirmatory test will extensively amplify under-diagnosis of false-negative test results.
Apparently, diagnostic accuracy in parasitology, especially in this era of Neglected Tropical Diseases, necessitates a supplementary quick simple and sensitive index test technique. Conventional direct microscopy as the method of choice for stool examination has shown to have a low parasite detection rate, therefore, greatly limited owing to poor sensitivity. Consequently, the likelihood of false-negative results will be on the increase. Subsequently, the under-diagnosis of parasitic infections will be misleading.
On the detection of different positive cases by the three index tests, the combined use of the three index tests provided a better diagnosis. However, despite the general improvement of the diagnosis in these cases, the low sensitivity reported for both tests indicates an important underestimation of the total number of positive cases.
Since this study was based on the analysis of a single stool sample collection, the day-to-day variation in the output of parasitic forms was not assessed, thus, the estimations of sensitivities could have been higher if more samples had been collected and analyzed. The low sensitivity of diagnostic tests for parasitic detection may be related to the rapid degeneration of some parasite ova eggs over time. Furthermore, sensitivity is influenced by delays between stool production and the analysis times in the laboratories (Dacombe et al., 2007; Knoop et al., 2009; Krauth et al., 2012) [6,35,36]. In this study, the detection rate (62.5%) for the composite gold reference standard extrapolated is less than the one reported in Ethiopia (Mulat et al., 2015) [4].
Comparative analysis of the composite gold reference standard extrapolated with the Bayesian Class Model shows that there is proximity between Bayesian class model and the composite reference standard proposed by Alonzo and Pepe (1999) [37]. Particularly for the sensitivities, as the sample size reduces because the discrepant results between the two reference tests are discarded, the 95% confidence intervals are wider. In this present study, the sensitivities of the composite gold standard and LCM shared statistical consistency while the other diagnostic indices of specificity, PPV and NPV, as well as prevalence, showed marked variation between the composite gold standard and LCM.
From the specific objectives which guided this study; the following were conclusively drawn.
Firstly, the diagnostic accuracies of selected index test techniques (Direct Microscopy, Brine Microscopy and Diethyl-Ether Microscopy) using an extrapolated/composite reference (gold) standard in this study generally were low. Nonetheless, the prevalence was a bit high. The use of composite gold standard as done in this study is similar in older studies however the diagnostic accuracies differ from this study. This imprecision of composite reference (gold) standard due to lack of perfect gold standard in parasitology is evident in previous studies (Devera et al., 2008; Knopp et al., 2009; Levecke et al., 2009; Brandelli et al., 2010; Dogruman-Al et al., 2010; Glinz et al., 2010; Steinmann et al., 2010; Inês et al., 2011; Carvalho et al., 2012) [6,11,34,38-43]. This practice has led to biased estimations of accuracy. This is consistent with some publications which posit that simpler alternatives to latent class analysis, such as the composite reference standards, are problematic (Schiller et al., 2018) [44].
Secondly, diagnostic concordance between the index techniques demonstrated very good inter-rater agreement for all three index test techniques. Remarkably, the result of the individual diagnostic accuracy influenced the diagnostic concordance for any two index tests as observed. This was seen as the two index test techniques with higher diagnostic accuracies had stronger agreement while the ones with lower diagnostic power demonstrated variation to a lesser extent although all showed good concordance.
Thirdly, the diagnostic accuracy using Bayesian Latent Class Model (LCM) amidst imperfect reference (gold) standard suggest some levels of diagnostic accuracy. In addition, the Statistical comparison of the composite reference (imperfect Gold) Standard with the Bayesian Class Model proves that LCM, as recorded, is a better tool than the imperfect gold reference standard from the study finding. This finding is in agreement with prior studies (Bachmann et al., 2006) [21]. A perfect diagnostic test otherwise known as gold standard or reference (with 100% sensitivity and specificity) is, for the most part, a theoretical concept. In practice, there are several diseases like tuberculosis, pneumonia, Alzheimer's disease including parasitic infection for which there is no perfect (gold standard) test that can detect the presence of the disease with certainty. This complicates estimation of disease prevalence as well as the evaluation of diagnostic tests accuracy (Lu et al., 2004) [45]. Notably, just a few studies have explored diagnostic accuracy of test techniques in parasitology using the concept of absence of a gold standard test or imperfect gold standard (Booth et al., 2003; Traub et al., 2009; Tarafder et al., 2010) [20,46,47]. This study has added to the number thereby, emphasizing the utilization of this mathematical model which possesses vast applications including malaria studies and other tropical diseases (Speybroeck et al., 2011; Canavate et al., 2011) [8,48]. Besides, a separate study presents several Bayesian latent class models for the diagnosis of visceral leishmaniasis (Menten et al., 2008) [49]. Limmathurotsakul, et al. explore some diagnostic tests for melioidosis (Limmathurotsakul et al., 2010) [50].
CONCLUSION/RECOMMENDATION
The single-use of direct microscopy for parasites identification as routinely done in the area of this present study is insufficient and may lead to false-negative results. Hence, it is preferable to use Diethyl-Ether Microscopy technique to complement other techniques including the direct microscopy. Also, the extrapolated-composite reference standard promises to be great instead of any single technique alone. However, all the combined results of the three diagnostic index test techniques are vastly influenced by parasite prevalence. Consequently, the same technique will have diverse values in different areas of prevalence. Hence, prevalence is a determinant factor.
Furthermore, the accuracy of diagnostic test algorithms for the diagnosis and detection based on solely use of any single microscopic technique as well as the use of imperfect gold standard have been criticized and alternative statistical approaches have emerged without wrongly assuming any of the diagnostic tests as a perfect gold standard. At this juncture, this present study addressed this issue with a novel Bayesian Class Model approach, in the helminth context to obtain valid outcome as observed in this study; thus recommended.
REFERENCES
- Alum A, Rubino JR, Ijaz MK. (2010). The global war against intestinal parasites--should we use a holistic approach? Int J Infect Dis. 14(9):e732-738.
- Harhay MO, Horton J, Olliaro PL, Utzinger J. (2011). Diagnostics are central for a truly holistic approach against intestinal parasitic diseases. Int J Inf Dis. 15(2):e76-e77.
- Gonçalves L, Subtil A, de Oliveira MR, do Rosário V, Lee PW, Shaio MF. (2012). Bayesian Latent Class Models in Malaria Diagnosis. PLoS ONE. 7(7):e40633.
- Yimer M, Hailu T, Mulu W, Abera B. (2015). Evaluation performance of diagnostic methods of intestinal parasitosis in school age children in Ethiopia. BMC Res Notes. 8: 820.
- Moges F, Belyhun Y, Tiruneh M, Kebede Y, Mulu A, Kassu A, et al. (2010). Comparison of formol-acetone concentration method with that of the direct iodine preparation and formol-ether concentration methods for examination of stool parasites. Ethiop J Health Dev. 24(2):148–151.
- Knopp S, Rinaldi L, Khamis IS, Stothard JR, Rollinson D, Maurelli MP, et al. (2009). A single FLOTAC is more sensitive than triplicate Kato-Katz for the diagnosis of low-intensity soil-transmitted helminth infections. Trans R Soc Trop Med Hyg. 103(4):347–354.
- Camacho M, Pessanha T, Leles D, Dutra JM, Silva R, Souza SM, et al. (2013). Lutz's spontaneous sedimentation technique and the paleoparasitological analysis of sambaqui (shell mound) sediments. Mem Inst Oswaldo Cruz. 108:155-159.
- Cañavate C, Herrero M, Nieto J, Cruz I, Chicharro C, Aparicio P, et al. (2012). Evaluation of two rK39 dipstick tests, direct agglutination test, and indirect fluorescent antibody test for diagnosis of visceral leishmaniasis in a New Epidemic Site in Highland Ethiopia. Am J Trop Med Hyg. 84: 102–106.
- Ribeiro SR. Furst C. (2012). Parasitological Stool Sample Exam by Spontaneous Sedimentation Method Using Conical Tubes: Effectiveness, Driving Range, and Biosafety. Rev Soc Bras Med Trop. 45:399-401.
- Tello R, Terashima A, Marcos LA, Machicado J, Canales M. Gotuzzo E. (2012). Highly effective and inexpensive parasitological technique for diagnosis of intestinal parasites in developing countries: spontaneous sedimentation technique in tube. Int J Infect Dis. 16:0–16.
- Devera R, Aponte M, Belandria M, Blanco Y, Requena I. (2008). Uso del método de sedimentaciónespontanea en el diagnóstico de parásitosintestinales.
- Sullivan M, Holly J. (2007). Insights into latent class analysis of diagnostic test performance. Biostatistics. 8(2).474-484.
- Dawid AP, Skene AM. (1979). Maximum likelihood estimation of observer error-rates using the EM algorithm, Appl Stat. 28:20-28.
- Walter SD, Irwig LM. (1988). Estimation of test error rates, disease prevalence, and relative risk from misclassified data: a review, J Clin Epidemiol. 41:923-937
- Pepe M. (2007). Insights into latent class analysis of diagnostic test performance. Biostat. 8(2):474–484.
- Goetghebeur E, Liinev J, Boelaert M, Van der Stuyft P. (2000). Diagnostic test analyses in search of their gold standard: latent class analyses with random effects. Stat Methods Med Res. 9:231–248.
- Black MA, Craig BA. (2002). Estimating Disease Prevalence in the Absence of Gold Standard. Stat Med. 21(18):2653-2669.
- Dendukuri N. Joseph L. (2001). Bayesian approaches to modeling the conditional dependence between multiple diagnostic tests. Biometrics. 57(1):158-167.
- Bernatsky S, Joseph L, Bélisle P, Boivin JF, Rajan R, Moore A, et al. (2005). Bayesian modelling of imperfect ascertainment methods in cancer studies. Stat Med. 24:2365–2379.
- Tarafder MR, Carabin H, Joseph L, Balolong E, Olveda R, McGarvey ST (2010). Estimating the sensitivity and specificity of Kato-Katz stool examination technique for detection of hookworms, Ascaris lumbricoides and Trichuris trichiura infections in humans in the absence of a gold standard. Int J Parasitol. 40(4):399-404.
- Bachmann LM, Puhan MA, ter Riet G, Bossuyt PM (2006). Sample sizes of studies on diagnostic accuracy: literature survey. Br Med J. 332:1127–1129.
- Joseph L, Gyorkos TW, Coupal L. (1995). Bayesian estimation of disease prevalence and the parameters of diagnostic tests in the absence of a gold standard. Am J Epidemiol. 141:263-272
- Gelman A, Rubin DB. (1992). Inference from iterative simulation using multiple sequences. Stat Sci. 7: 457–472.
- Smith BJ. (2007) BOA: An R package for MCMC output convergence assessment and posterior inference. Journal of Statistical Software 21: 1–37.
- Nérette P, Stryhn H, Dohoo I, Hammell L. (2008). Using pseudogold standards and latent-class analysis in combination to evaluate the accuracy of three diagnostic tests. Prev Vet Med. 85:207–225.
- Neelon B, O'Malley AJ, Normand SL. (2011) A Bayesian two-part latent class model for longitudinal medical expenditure data: Assessing the impact of mental health and substance abuse parity. Biometrics. 67:280–289.
- Broemeling DL. (2009). Bayesian Methods for Measures of Agreement (Chapman & Hall/CRC Biostatistics Series). Chapman and Hall/CRC Press.
- Peeling RW, Smith PG, Bossuyt PMM. (2007).A guide for diagnostic evaluations.Nature Rev Microbiol. 5(11):S2–S6.
- Boelaert M, Bhattacharya S, Chappuis F, el Safi SH, Hailu A, Mondal D, et al. (2007). Evaluation of rapid diagnostic tests: visceral leishmaniasis. Nat Rev Microbiol. 5(11):S30–S39.
- Endris M, Tekeste Z, Lemma W, Kassu A. (2013). Comparison of the Kato-Katz, Wet Mount, and formol-ether concentration diagnostic techniques for intestinal helminth infections in Ethiopia. ISRN Parasitol. 2013: 180439.
- Sheyin Z, Bigwan EI, Galadima M. (2013). Comparison of formol-ether, direct smear and nigrosine methylene blue for the diagnosis of human intestinal parasites. J Microbiol Res Rev. 1(3):30–34.
- Santos FL, Cerqueira EJ, Soares NM. (2005).Comparison of the thick smear and Kato-Katz techniques for diagnosis of intestinal helminth infections. Rev Soc Bras Med Trop. 38(2):196–198.
- Ritchie LS. (1984). An ether sedimentation technique for routine stool examination. Bull U S Army Med Dep. 8(4):326.
- Levecke B, Wilde ND, Vandenhoute E, Vercruysse J. (2009). Field validity and feasibility of four techniques for the detection of Trichuris trichuira in Simians: a model for monitoring drug efficacy in public health. PLoS Neg Trop Dis. 3(1):e366.
- Dacombe RJ, Crampin AC, Floyd S, Randall A, Ndhlovu R, Bickle Q, et al. (2007). Time delays between patient and laboratory selectively affect accuracy of helminth diagnosis. Trans R Soc Trop Med Hyg. 101:140-145.
- Krauth SJ, Coulibaly JT, Knopp S, Traoré M, N'Goran EK, Utzinger J. (2012). An in-depth analysis of a piece of shit: distribution of Schistosomamansoni and hookworm eggs in human stool. PLoS Negl Trop Dis. 6(12):e1969.
- Alonzo TA, Pepe MS. (1999). Using a combination of reference tests to assess the accuracy of a new diagnostic test. Stat Med. 18: 2987–3003.
- Brandelli CL, Cargnin ST, Willers DM, Oliveira KR, Tasca T. (2011). Comparison between spontaneous sedimentation method and Paratest® for the diagnosis of intestinal parasitic infections. Trans R Soc Trop Med Hyg. 105(10):604-606.
- Dogruman-Al F, Simsek Z, Boorom K, Ekici E, Sahin M, Tuncer C, et al. (2010). Comparison of methods for detection of Blastocystis infection in routinely submitted stool samples, and also in IBS/IBD patients in Ankara, Turkey. PLoS One. 5(11):e15484.
- Glinz D, Silué KD, Knopp S, Lohourignon LK, Yao KP, Steinmann P, et al. (2010). Comparing diagnostic accuracy of Kato-Katz, Koga agar plate, ether-concentration, and FLOTAC for Schistosoma mansoni and soil-transmitted helminths. PLoS Negl Trop Dis. 4(7):e754.
- Steinmann P, Utzinger J, Du ZW, Zhou XN. (2010). Multiparasitism: A Neglected reality on global, regional and local Scale. Adv Parasitol. 73(C):21-50.
- Inês Ede J, Souza JN, Santos RC, Souza ES, Santos FL, Silva ML, et al. (2011). Efficacy of parasitological methods for the diagnosis of Strongyloidesstercoralis and hookworm in faecal specimens. Actatropica. 120(3):206–210.
- Carvalho GL, Moreira LE, Pena JL, Marinho CC, Bahia MT, Machado-Coelho GL. (2012). A comparative study of the TF-Test®, Kato-Katz, Hoffman-Pons-Janer, Willis and Baermann-Moraescoprologic methods for the detection of human parasitosis.Mem Inst Oswaldo Cruz. 107:80-84.
- Dendukuri N, Schiller I, de Groot J, Libman M, Moons K, Reitsma J, et al. (2018). Concerns about composite reference standards in diagnostic research. MJ Clin Res. 360:5779
- Lu Y, Dendukuri N, Schiller I, Joseph LA. (2010).Bayesian approach to simultaneously adjusting for verification and reference standard bias in diagnostic test studies. Stat Med. 29(24):2532-2543.
- Booth M, Vounatsou P, N'goran EK, Tanner M, Utzinger J. (2003). The influence of sampling effort and the performance of the Kato-Katz technique in diagnosing Schistosomamansoni and hookworm co-infections in rural Côte d’Ivoire. Parasitol. 127:525-531
- Traub RJ, Inpankaew T, Reid SA, Sutthikornchai C, Sukthana Y, Robertson ID, et al. (2009). Transmission cycles of Giardia duodenalis in dogs and humans in Temple communities in Bangkok-A critical evaluation of its prevalence using three diagnostic tests in the field in the absence of a gold standard. Acta Trop. 111(2):125-132.
- Speybroeck N, Praet N, Claes F, Van Hong N, Torres K, Mao S, et al. (2011). True versus apparent malaria infection prevalence: The contribution of a Bayesian approach. PLoS ONE 6:e16705.
- Menten J, Boelaert M, Lesaffre E. (2008) Bayesian latent class models with conditionally dependent diagnostic tests: A case study. Stat Med. 27:4469–4488.
- Limmathurotsakul D, Jamsen K, Arayawichanont A, Simpson JA, White LJ, Lee SJ, et al. (2010). Defining the true sensitivity of culture for the diagnosis of melioidosis using Bayesian latent class models. PloS One. 5(8)